Kalshi NFL Week 1 Vig: Totals Drive Its Pricing Lead
Citizens' NFL pricing snapshot gives Kalshi a narrow overall lead, while FanDuel wins moneylines and sportsbooks lead sampled combos.
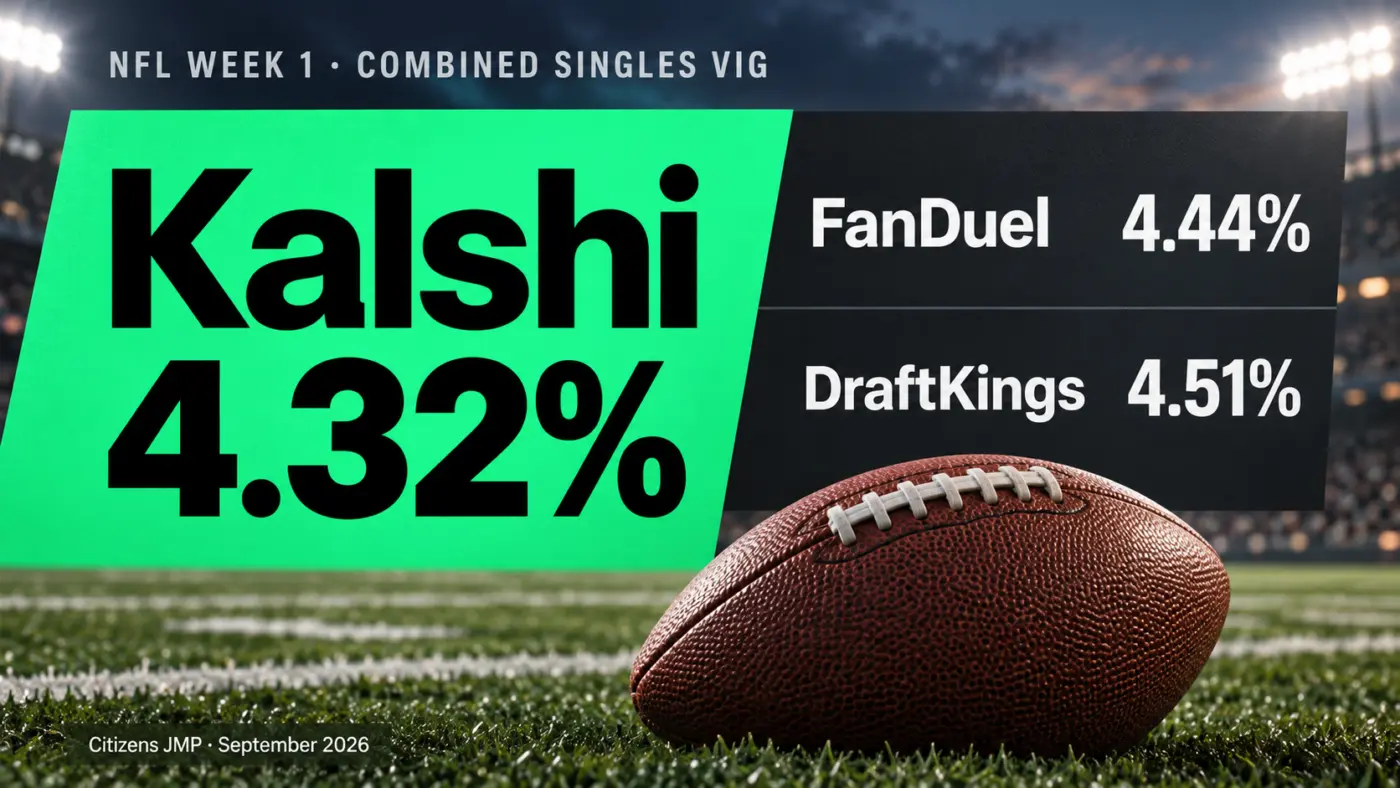
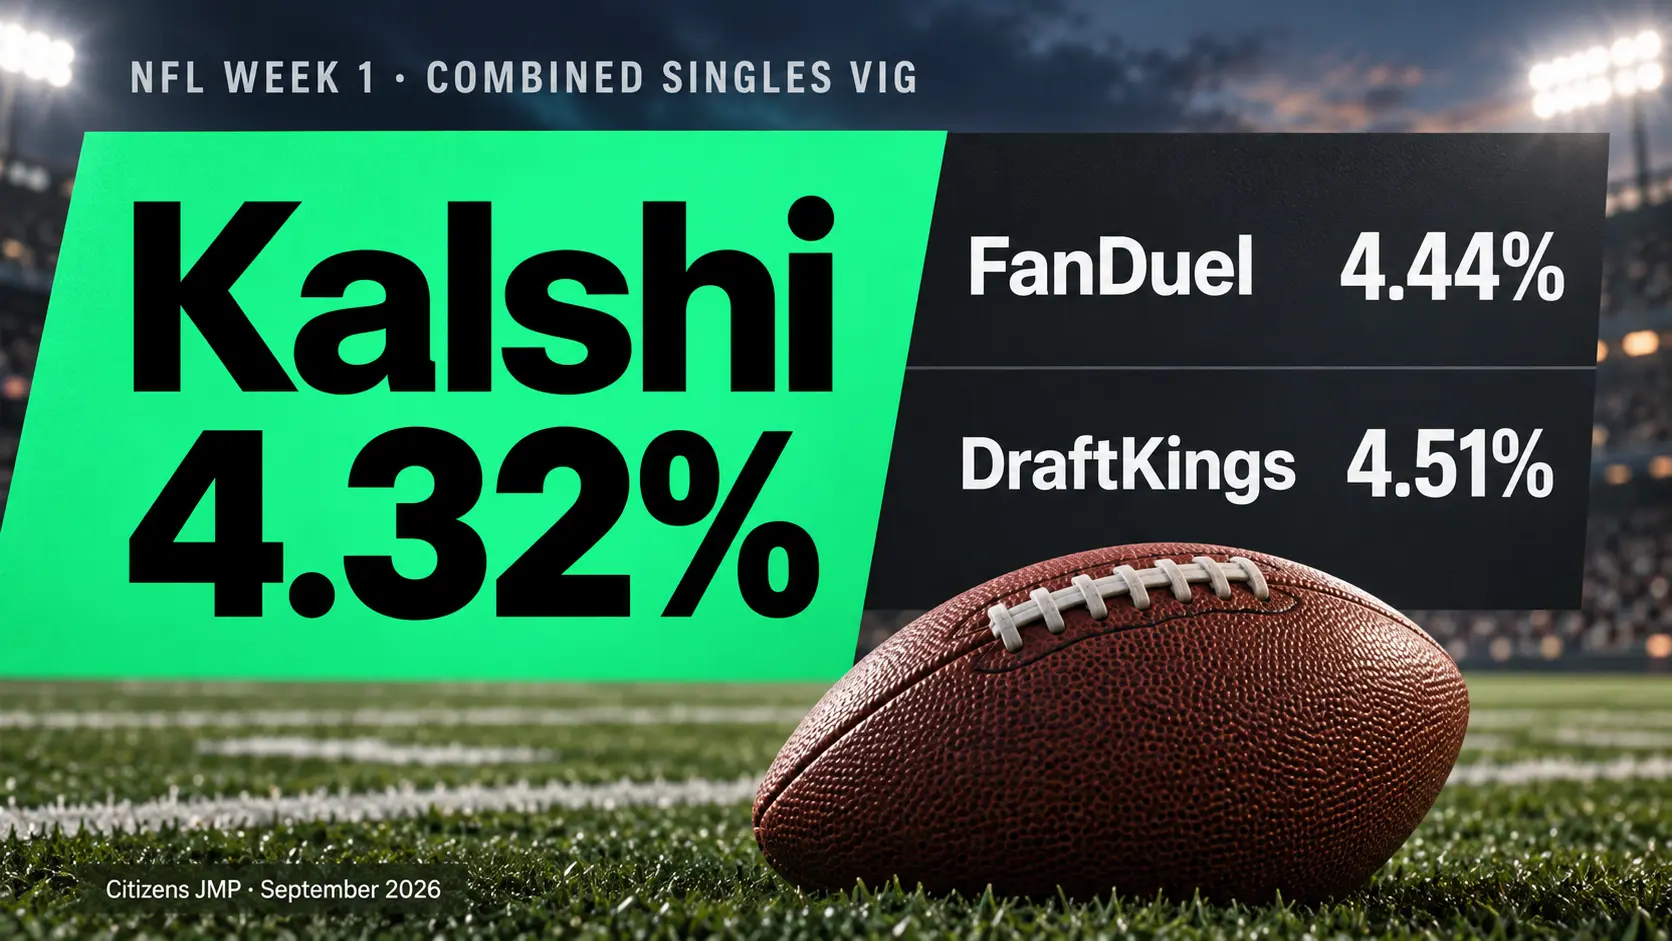
Kalshi NFL Week 1 vig averaged 4.32% in Citizens JMP Securities’ opening-week pricing sample, below FanDuel’s 4.44% and DraftKings’ 4.51%. The September 14, 2026 report gives Kalshi a narrow combined singles lead driven by totals, while FanDuel led moneylines and both sportsbooks beat Kalshi on the sampled combos.
KEY FACTS AT A GLANCE
- Source and scope: Citizens JMP Securities sampled 28 moneyline and totals observations on Friday afternoon, September 11, for Sunday’s and Monday’s NFL games.
- Combined singles vig: Citizens reported Kalshi at 4.32%, FanDuel at 4.44% and DraftKings at 4.51%.
- Market split: FanDuel led Citizens’ moneyline comparison; Kalshi led its totals comparison.
- Combo comparison: Citizens’ 14 favorite-plus-over observations put Kalshi at 23.8% before transaction fees, against 22.0% at each sportsbook.
- Fee limitation: The report does not explicitly explain how transaction fees enter the headline singles figure.
Totals drove Kalshi’s combined pricing lead
A moneyline is a bet on which team wins. A total concerns the combined score going over or under a specified number. Separating those markets changes the reading of Citizens’ headline average.
On moneylines, Citizens measured FanDuel at 4.08%, Kalshi at 4.14% and DraftKings at 4.31%. On totals, Kalshi’s 4.50% was below DraftKings’ 4.71% and FanDuel’s 4.80%. Kalshi’s stronger totals result was enough to put it first in the combined sample.
View chart data
| Market | Kalshi | FanDuel | DraftKings |
|---|---|---|---|
| Combined singles | 4.32% | 4.44% | 4.51% |
| Moneylines | 4.14% | 4.08% | 4.31% |
| Totals | 4.50% | 4.80% | 4.71% |
The overall difference was small. Subtracting Citizens’ reported averages gives Kalshi a lead of 0.12 percentage points against FanDuel and 0.19 against DraftKings. Those are 12 and 19 basis points, respectively; one basis point is one-hundredth of a percentage point.
Kalshi was competitive on the sampled NFL singles and led their average. That does not establish the best price for every side of every game. Dyutam’s earlier March Madness pricing analysis covered a separate tournament sample; this NFL snapshot needs to stand on its own.
What the vig comparison leaves unresolved
Vig describes the margin embedded in quoted prices. In a conventional two-outcome sportsbook market, converting each side’s odds into implied probabilities and adding them reveals the excess above 100%. Readers unfamiliar with that conversion can start with how betting odds work and use Dyutam’s vig calculator to inspect a particular pair of sportsbook quotes.
Citizens does not publish its full calculation method or raw per-game prices for this comparison. Its reported vig should therefore remain an attributed pricing measure. It is distinct from realized hold, the share of stakes a sportsbook retains after settling bets, and from Kalshi’s fee revenue. The gap between two averages also cannot be translated directly into guaranteed savings on a $100 wager.
IMPORTANT NOTICE
Citizens’ report identifies a Friday-afternoon sample of Sunday and Monday games, rather than every Week 1 game. It provides no raw prices, precise observation timestamps, stake sizes or executable order-book depth. The figures cannot be independently reproduced from the published report.
Fees are the main unresolved part of the headline comparison. Citizens reports an average Kalshi transaction fee of $1.62 per 100 contracts, but does not explicitly define whether, or how, that fee enters the 4.32% singles figure. Labeling that number definitively before fees or after fees would go beyond the document. Adding 1.62 percentage points would also mix a cash charge per contract quantity with a percentage measure on an unspecified basis.
Kalshi’s published fee schedule shows why the contract price matters. Its standard taker-fee table lists a $1.75 fee for 100 contracts priced at 50 cents each. That is a $50 contract purchase plus a $1.75 fee, or $51.75 in total, under that example. Actual charges depend on the market’s applicable schedule and the order; a resting order should not automatically be assumed fee-free.
Execution matters too. Kalshi’s limit-order guidance explains that an order needs matching liquidity and can fill only partially. A useful comparison requires the same outcome, a comparable payout and the price available for the desired size, including applicable fees. A favorable screen quote alone does not settle that calculation.
The sampled combos favored sportsbooks
Citizens also tested 14 combinations pairing a game’s favorite with the over. Its reported combo vig was 23.8% at Kalshi before transaction fees, compared with 22.0% at both FanDuel and DraftKings. The fees qualification is explicit for this comparison.
View chart data
| Operator | Vig |
|---|---|
| Kalshi | 23.8% |
| FanDuel | 22.0% |
| DraftKings | 22.0% |
The result covers those particular combinations. It does not rank every parlay or every number of legs. Combining selections also introduces a different pricing problem, especially when their outcomes are related; Dyutam’s parlay betting guide explains how the combined wager works.
Kalshi already offers its own combos. Its help documentation describes a request-for-quote process, with prices that can change and execution that is not guaranteed. The competition therefore extends across singles and combinations on both exchanges and sportsbooks. This sample gives Kalshi a singles headline, but gives the sportsbooks the advantage on the tested combos.
Why parlays remain central to sportsbook economics
DraftKings’ own figures show how much its business mix has shifted. Its March 2026 Investor Day presentation reports that parlays accounted for 21% of total sportsbook handle in 2020 and 32% in 2025. Handle means the amount wagered. These percentages cover the sportsbook across sports, rather than NFL betting alone.
View chart data
| Year | Share |
|---|---|
| 2020 | 21% |
| 2021 | 20% |
| 2022 | 24% |
| 2023 | 26% |
| 2024 | 28% |
| 2025 | 32% |
A sportsbook’s economics depend partly on which products customers choose. A larger share of wagers flowing into parlays makes that product’s pricing and retention value more consequential to the business. A close contest over singles can coexist with a broader commercial focus on combinations. The handle trend alone does not establish how much of DraftKings’ revenue or profit growth parlays caused.
Nor does the operator strategy reduce to raising margins indefinitely. In its August 2026 results, FanDuel parent Flutter described a change in emphasis:
“move from a focus on margin growth, to prioritizing AMP growth and customer value.”
— Flutter, second-quarter 2026 results
AMP refers to average monthly players. The statement puts customer growth and value alongside margin in assessing FanDuel’s priorities. DraftKings also operates a predictions business, as its August 2026 results make clear. The companies themselves are participating on both sides of the exchange-versus-sportsbook comparison.
The practical lesson from Week 1 is to compare the specific market. Citizens’ aggregate favored Kalshi, its moneylines favored FanDuel, and its tested combos favored both sportsbooks. Fees and the executable price still determine what a particular transaction costs. One dated snapshot supplies a useful benchmark, not a season-long winner.
FAQs
No. Citizens JMP Securities reported lower combined singles vig and lower totals vig at Kalshi, but FanDuel led its moneyline comparison. Both sportsbooks had lower reported vig on the sampled favorite-plus-over combos.
Citizens does not explicitly explain how transaction fees enter its 4.32% singles figure, so it cannot be confidently labeled before or after fees. The report explicitly identifies Kalshi’s sampled combo comparison as excluding transaction fees.
No. Vig describes the margin implied by quoted prices, while realized hold measures the share of stakes a sportsbook retains after bets settle. Neither measure should be treated as identical to a prediction exchange’s transaction-fee revenue.
Kalshi offers multi-selection contracts called combos. Its help documentation describes a request-for-quote process in which prices can change and execution is not guaranteed. A singles pricing advantage therefore does not establish an advantage on Kalshi combos.
Yes. Kalshi’s guidance says combo quotes can change, while limit orders need matching liquidity and may fill only partially. Compare the available price for the intended order size and include applicable fees when assessing the transaction’s cost.
No. Citizens’ findings reflect a Friday-afternoon snapshot of selected Sunday and Monday markets. Different games, observation times, fees and available liquidity can change the comparison, and the published report does not supply enough raw data to reproduce its averages independently.
KEY TAKEAWAYS
- Kalshi’s lead was narrow and market-specific — Citizens’ combined average favored Kalshi, while FanDuel led moneylines.
- Fees remain material — Citizens does not explicitly define their treatment in the headline singles figure; its Kalshi combo figure is before fees.
- Sportsbooks won the tested combos — Citizens’ favorite-plus-over sample does not establish a ranking for all parlays.
- Parlays occupy more of DraftKings’ betting mix — its Investor Day figures show a rising share of total sportsbook handle between 2020 and 2025, across sports.
Sources
- NFL Week 1 pricing report, September 14, 2026 — Citizens JMP Securities
- Trading fee schedule — Kalshi
- Fees — Kalshi Help Center
- Limit Orders — Kalshi Help Center
- Combos — Kalshi Help Center
- 2026 Investor Day presentation, slide 60 — DraftKings
- Second-quarter 2026 results — DraftKings
- Second-quarter 2026 results, August 5, 2026 — Flutter Entertainment, SEC filing

Aevan Lark
Aevan Lark is a gambling industry veteran with over 7 years of experience working behind the scenes at leading crypto casinos — from VIP management to risk analysis and customer operations. His insider perspective spans online gambling, sports betting, provably fair gaming, and prediction markets. On Dyutam, Aevan creates in-depth guides, builds verification tools, and delivers honest, data-driven reviews to help players understand the odds, verify fairness, and gamble responsibly.
Related coverage
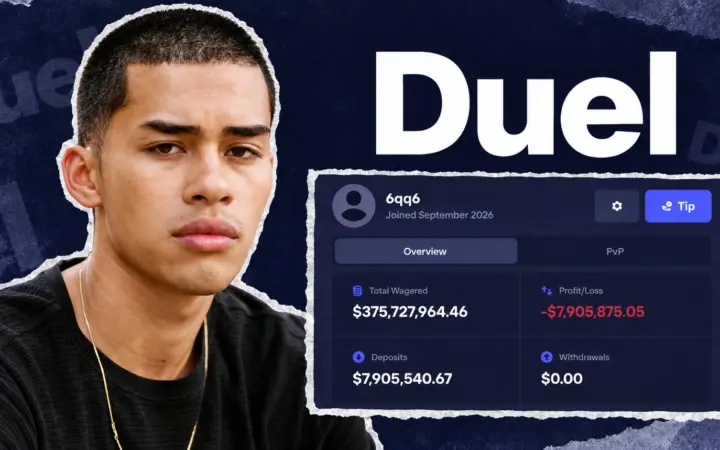
Duel.com Controversy: Fake-Volume Claims and the Sneako Clip
Conflicting wager records and an unconfirmed AI label: what the evidence establishes about Duel.com’s volume dispute and the Sneako clip.

Mark Locke: Prediction Markets Can Outlast Today’s Rules
Mark Locke expects enduring wagering demand, while taxes, court disputes and settlement questions test the structure of sports prediction markets.

Stake Blocked Ireland After GRAI Pressure, Eyes License
Stake has closed Irish registrations and intends to seek a license, while prediction-market restrictions and customer refund questions remain distinct.